Uptime monitoring
Synthetic (HTTP/HTTPS) monitors hit your endpoints on a schedule and record status, response characteristics, and history. On a service board, synthetic rows sit alongside third-party vendors and catalog-backed entities so you get one view of production health: global banner, legend (operational, downtime, degraded, maintenance), and per-monitor bars over time.
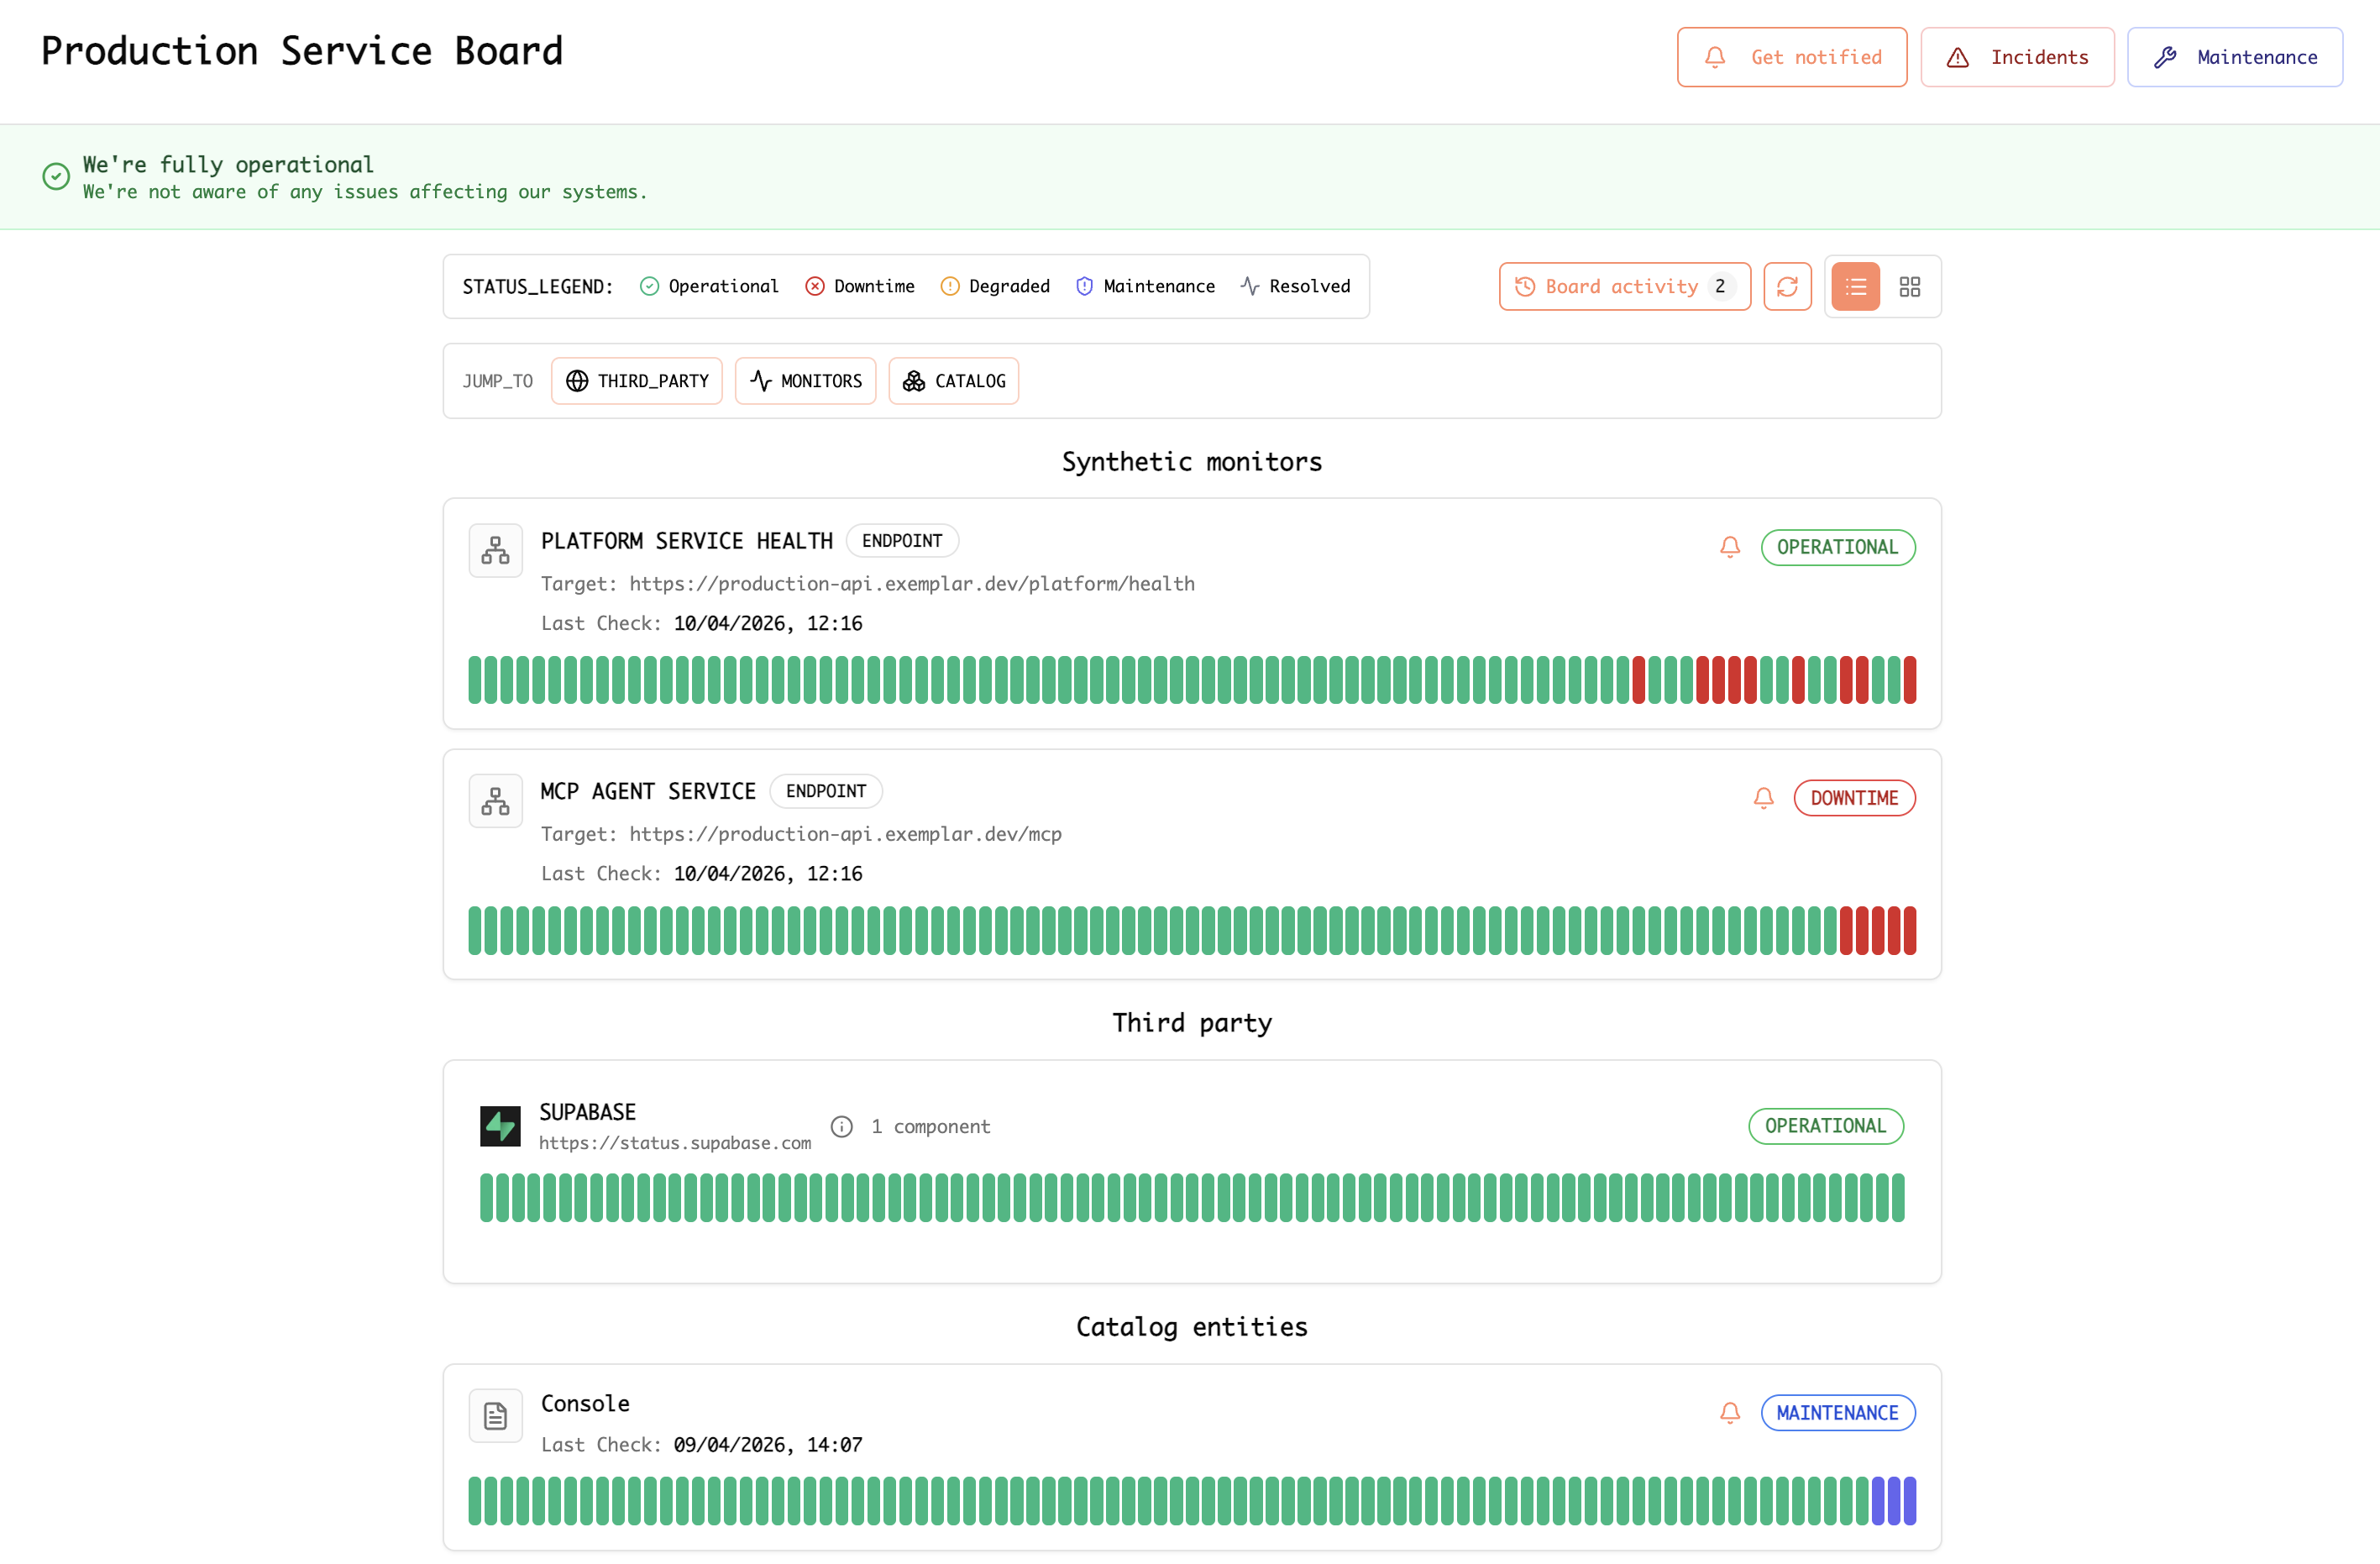
Example: service board showing synthetic monitors (for example platform health and MCP endpoints), third-party status, and catalog rows.
How To: API health monitoring and Slack & email alerts
Step-by-step guide
Work in the Exemplar console .
-
Open monitoring for your endpoints — Go to the area where synthetic, uptime, or API health monitors are created and managed.
-
Create an API health monitor — Add a new monitor and point it at your HTTP(S) health or API URL (for example
/health,/ready, or a lightweight authenticated probe if your product supports it). Choose method, expected status or body checks, and a run interval that matches how fast you need to detect outages without overloading the endpoint. -
Define “healthy” — Set success criteria: status codes, response time thresholds, optional SSL or keyword checks, and any regions or locations you want probes from, if offered.
-
Attach the monitor to your operational view — Add the monitor to a service board or equivalent so operators see it with other signals (vendors, catalog entities) and history bars over time.
-
Connect Slack — In notifications, integrations, or alert destinations, add Slack. Complete OAuth or webhook setup, pick a channel (for example
#incidentsor#platform-alerts), and map severity or incident types to that channel if the UI allows. -
Configure email alerts — Add email as a destination: team or on-call addresses, and when to send (for example on failure, recovery, or degraded). Confirm subscription or verification steps if required.
-
Test end-to-end — Trigger a controlled failure (for example a temporary bad response in a staging URL) or use a test notification if available. Confirm messages appear in Slack and email with the expected wording and links back to the monitor or incident.
-
Document ownership — Note who owns the monitor URL, rotation for the Slack channel, and who must stay on the email list so alerts stay actionable.
Blog
- Why uptime and synthetic monitors still matter in the age of APM — How synthetics complement APM and telemetry; probes, SSL, vendor feeds, incidents, and status boards.