Vendor status aggregator
Exemplar aggregates public status feeds from critical third-party vendors and infrastructure providers your organization depends on — including cloud platforms, SaaS providers, communication systems, CI/CD tools, AI providers, developer platforms, and observability services.
This unified operational view helps teams quickly understand whether incidents originate from internal systems or external dependencies, reducing investigation time during outages and degraded service events.
Each vendor card includes:
- Current operational status
- Vendor status page URL
- Historical status timeline
- Associated incidents and degradations
- Service health visibility across providers
The dashboard consolidates vendor reliability signals into a single operational workspace alongside your synthetic monitors, incidents, maintenance events, and status boards.
The historical status indicators help visualize vendor reliability trends over time:
- Green indicates healthy or operational systems
- Orange represents degraded performance or partial disruption
- Red signals major outages or critical incidents
- Grey indicates limited, unavailable, or incomplete status signals
- Blue represents scheduled maintenance or planned operational activity
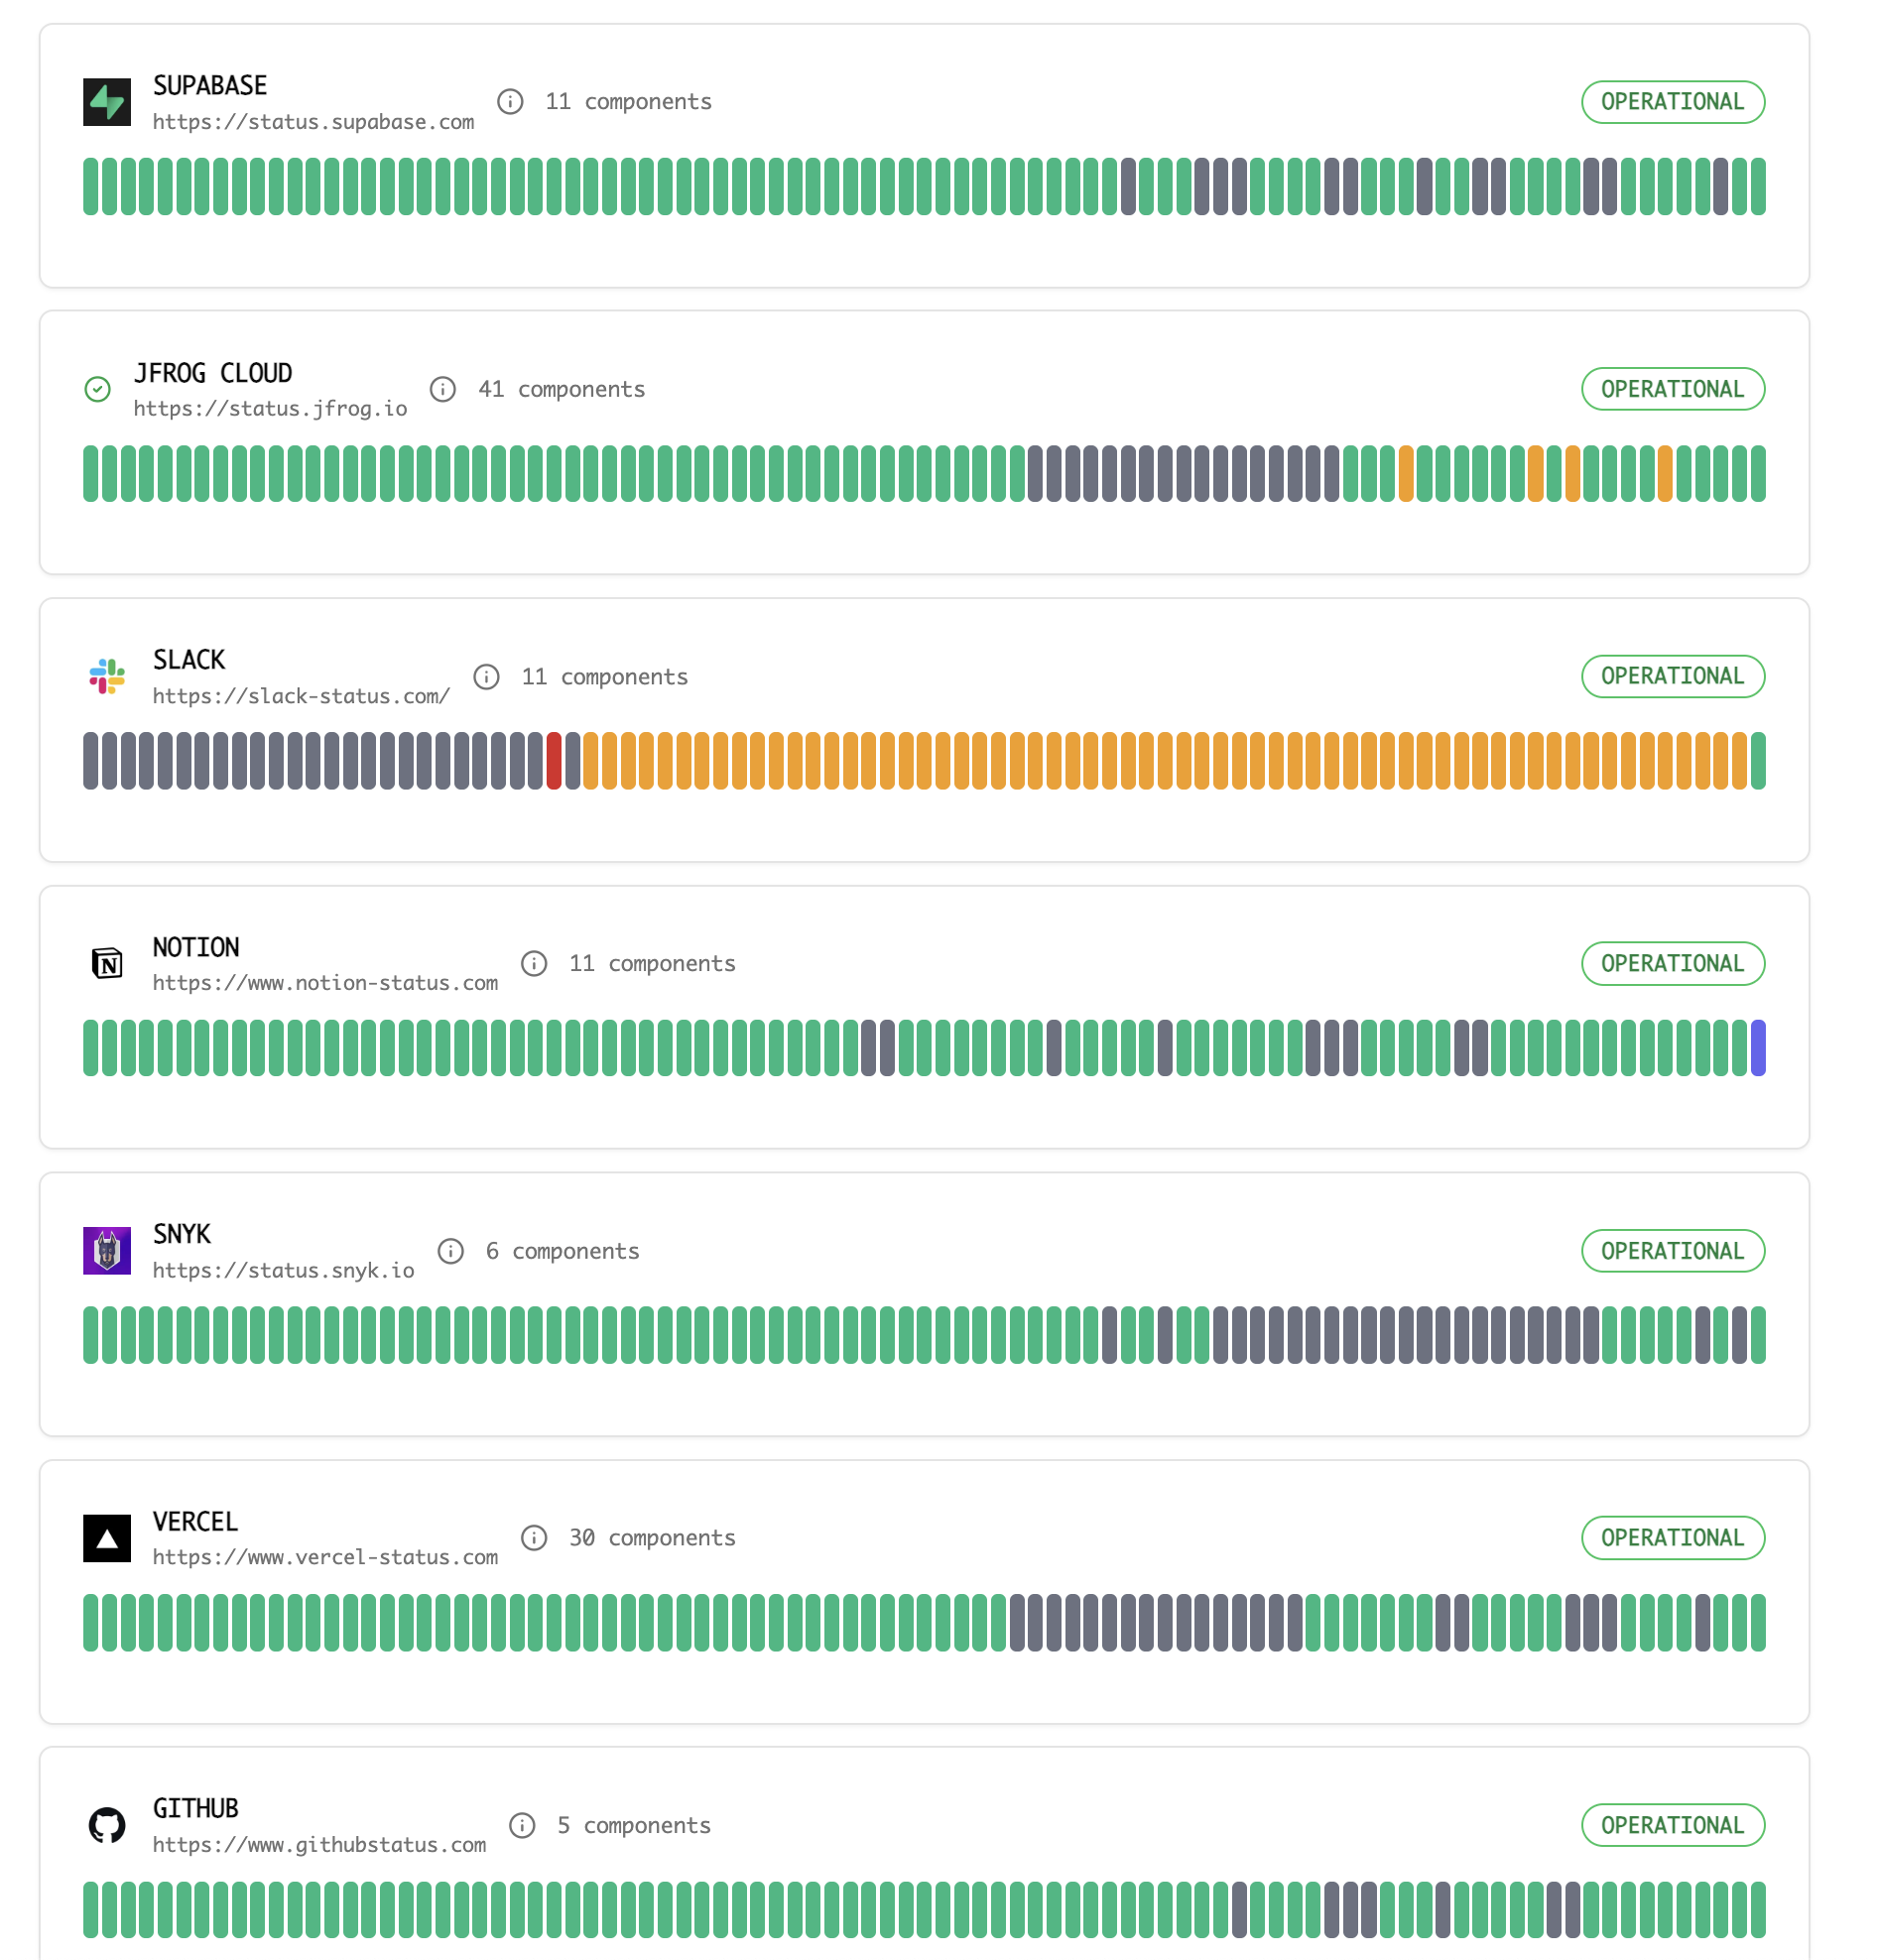
Example: aggregated third-party vendor status with per-vendor history.
How To: Create and Share a Third-Party Services Status Board
Why vendor status aggregation matters
Modern platforms depend on dozens of external services across infrastructure, communication, analytics, CI/CD, monitoring, AI tooling, and developer workflows.
When external providers experience outages or degraded performance, centralized visibility helps teams:
- Quickly identify dependency-related incidents
- Reduce troubleshooting and escalation time
- Correlate vendor outages with internal alerts
- Improve operational communication
- Share vendor health visibility with stakeholders
- Track historical vendor reliability trends
For example, teams can monitor providers like Cloudflare, OpenAI, GitHub, Stripe, Slack, and Firebase from a single operational dashboard instead of checking multiple status pages individually.
Supported third-party vendors
Exemplar currently aggregates operational signals from a broad range of third-party services and platforms, including:
- Sentry
- JFrog
- Snyk
- Harness
- Trello
- MoEngage
- Twilio
- npm
- Notion
- Travis CI
- Google Cloud Platform (GCP)
- Temporal
- Twingate
- Firebase
- ElevenLabs
- Slack
- Cloudflare
- 100ms
- Square
- DigitalOcean
- Cursor
- Segment
- Intercom
- Daily
- Tally
- CircleCI
- Ably
- JitPack
- Elastic
- GitHub
- Jira
- Modal
- Vercel
- Fly.io
- Claude
- Confluence
- Brevo
- Statuspage
- MongoDB
- Sarvam AI
- Airtable
- Confluent
- SparkPost
- Supabase
- Google Workspace
- Zoom
- Linear
- OpenAI
- Docker
- Stripe
Additional vendors and integrations may continue expanding over time.
Operational workflows
Vendor status aggregation becomes especially useful during:
- Incident triage and escalation
- Production investigations
- External dependency failures
- Customer communication workflows
- Status board publishing
- Service reliability analysis
- Platform-wide operational reviews
Teams can correlate third-party outages alongside:
- Synthetic uptime monitors
- SSL monitoring
- Incident timelines
- Maintenance windows
- Service catalog entities
- Published status pages
This creates a centralized operational experience for both internal responders and external stakeholder communication.
Related
Blog
- Why uptime and synthetic monitors still matter in the age of APM — How first-party probes and aggregated vendor feeds fit alongside APM and telemetry.